Many asynchronous programs make use of promises (also known as using light-weight threads or an asynchronous monad) to manage concurrency. I've been working on tools to collect trace data from such programs and visualise the results, to help with profiling and debugging.
The diagram below shows a trace from a Mirage unikernel reading data from disk in a loop. You should be able to pan around by dragging in the diagram, and zoom by using your mouse's scroll wheel. If you're on a mobile device then pinch-to-zoom should work if you follow the full-screen link, although it will probably be slow. If nothing else works, the ugly zoom buttons at the bottom zoom around the last point clicked.
The web viewer requires JavaScript and HTML canvas support. If it doesn't work, you can also build the trace viewer as a (much faster) native GTK application.
In this post I'll explain how to read these diagrams, and how to trace your own programs.
( this post also appeared on Hacker News and Reddit )
Table of Contents
Introduction
Many asynchronous programs make use of promises (also known as using light-weight threads or an asynchronous monad). A promise/thread is a place-holder for a value that will arrive in the future.
Here's a really simple example (an OCaml program using Lwt). It creates a thread that resolves to unit (void) after one second:
1 2 3 4 5 6 7 8 9 | |
In the diagram, time runs from left to right. Threads (promises) are shown as horizontal lines. The diagram shows:
- Initially, only the main thread ("0") is present.
- The main thread then creates a new thread, labelled "sleep".
- The sleep thread is a "task" thread (this is just a helpful label added when the thread is created).
- The whole process then goes to sleep for one second, which is shown by the darker background.
- At the end of the second, the process wakes up and resolves the sleep thread to its value (unit), shown by the green arrow.
- The main thread, which was waiting for the sleep thread, reads the value (the blue arrow) and exits the program.
If you zoom in on the arrows (go down to a grid division of about 10 microseconds), you'll also see a white segment on the main thread, which shows when it was running (only one thread runs at a time).
Because thread 0 is actually the main event loop (rather than a Lwt thread), things are a little more complicated than normal. When the process has nothing to do, thread 0 puts the process to sleep until the next scheduled timer. When the OS wakes the process, thread 0 resumes, determines that the "sleep" thread can be resolved, and does so. This causes any callbacks registered on the sleep thread to be called, but in this case there aren't any and control returns to thread 0. Thread 0 then checks the sleep thread (because that determines when to finish), and ends the loop because it's resolved.
Bind
Callbacks can be attached to a promise/thread to process the value when it arrives. Attaching the callback immediately creates a new promise for the final result of the callback.
Here's a program that sleeps twice in series.
The >>= (bind) operator attaches the callback function to the first thread.
I've made the sleeps very short so you can see the process waking up without having to zoom.
1 2 3 | |
In this case, the main thread creates two new threads at the start: one for the result of the first sleep and a second ("bind") for the result of running the callback on the result. It's easier to see how the first thread is resolved here: the main thread handling the polling loop wakes up and resolves the sleep thread, which then causes the bind thread to resume.
You might wonder why the bind thread disappears when the second sleep starts. It hasn't finished, but when the bind's callback function returns the second sleep thread as its result, the bind thread is merged with the sleep thread. This is the asynchronous equivalent of a tail call optimisation, allowing us to create loops without needing an unbounded number of threads.
Actually, displaying binds in this way tends to clutter up the diagrams, so the viewer has a simplification rule that is enabled by default: if the first event on a bind thread is a read, the part of the bind up to that point isn't drawn. Therefore, the default display for this program is:
If you zoom in on the central green arrow, you can see the tiny remaining bind thread between the two sleeps.
Join
Lwt.join waits for a collection of threads to finish:
1 2 3 4 5 6 | |
In the trace, you can see the join thread being notified each time one of the threads it's waiting for completes. When they're all done, it resolves itself.
Choose
Lwt.choose is similar to join, but only waits until one of its threads finishes:
1 2 3 4 5 6 | |
I cheated a bit here.
To avoid clutter, the viewer only draws each thread until its last recorded event (without this, threads that get garbage collected span the whole width of the trace), so I used Profile.label ~thread "(continues)" to create extra label events on the two remaining threads to make it clearer what's happening here.
Pick
Lwt.pick is similar to choose, but additionally cancels the other threads:
1 2 3 4 5 6 | |
Exceptions
Failed threads are shown with a red bar at the end and the exception message is displayed. Also, any "reads" arrow coming from it is shown in red rather than blue. Here, the bind thread fails but the try one doesn't because it catches the exception and returns unit.
1 2 3 4 5 6 | |
Note: I'm using the Lwt syntax extension here for try_lwt, but you can use Lwt.try_bind if you prefer.
The same simplification done for "bind" threads also applies to "try" threads, so the try thread doesn't appear at all until you zoom in on the red arrow.
Making your own traces
Update: These instructions were out-of-date so I've removed them. See the mirage-profile page for up-to-date instructions.
Examples
A few months ago, I made my first unikernel - a REST service for queuing files as a Xen guest OS. Unlike a normal guest, which would include a Linux kernel, init system, libc, shell, Apache, etc, a Mirage unikernel is a single executable, and almost pure OCaml (apart from malloc, the garbage collector, etc). Unikernels can be very small and simple, and have a much smaller attack surface than traditional systems.
For my first attempt at optimising the unikernel, I used OCaml's built-in profiling support. This recorded function calls and how much time was spent in each one. But I quickly discovered that CPU time was rarely the important factor - how the various asynchronous threads were scheduled was more important, and the tracing made it difficult to see this.
So, let's see how the new tracing does on my previous problems...
Profiling the console
In the previous profiling post, I generated this graph using libreoffice:
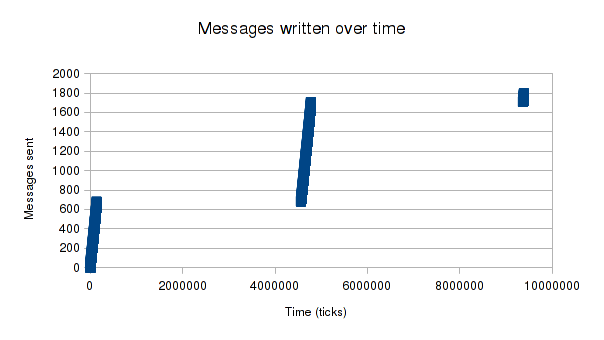
As a reminder, Xen guests output to the console by writing the text to a shared memory page, increasing a counter to indicate this, and signalling dom0. The console logger in dom0 reads the data, increments another counter to confirm it got it, and signals back to the guest that that part of the buffer is free again.
To use the new tracing system, I added a Profile.note_increase "sent" len to the main loop, which increments a "sent" count on each iteration (i.e. each time we write a line to the console).
The viewer adds a mark on the trace for each increment and overlays a graph (the red line) so you can see overall progress easily:
View full screen | Download console.sexp
As before, we can see that we send messages rapidly in bursts, followed by long periods without progress. Zooming in to the places where the red line is increasing, we can see the messages being written to the buffer without any delays. Looking at the edges of the sleeping regions, it's clear that we're simply waiting for Xen to notify us of space by signalling us on event channel 2.
Here's the complete test code:
1 2 3 4 5 6 7 8 9 10 11 12 13 14 15 16 17 18 19 20 21 22 23 24 25 26 27 28 29 | |
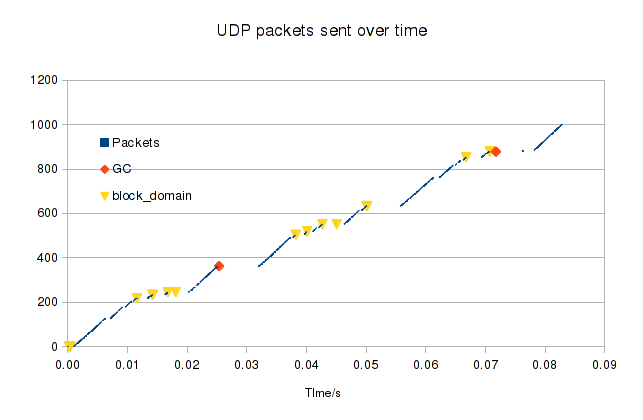
UDP transmission
Last time, we saw packet transmission being interrupted by periods of sleeping, garbage collection, and some brief but mysterious pauses.
I noted that the GC tended to run during Ring.ack_responses, suggesting that was getting called quite often, and with the new tracing we can see why.
This trace shows a unikernel booting (scroll left if you want to see that) and then sending 10 UDP packets. I've left the trace running a little longer so you can see the acks (this is very obvious when sending more than 10 packets, but I wanted to keep this trace small):
View full screen | Download udp.sexp
Mirage creates two threads for each packet that we add to the ring buffer and they stick around until we get a notification back from dom0 that the packet has been read (actually, we create six threads for each packet, but the bind simplification hides four of them).
It looks like each packet is in two parts, as each one generates two acks, one much later than the other. I think the two parts are the UDP header and the payload, which each have their own IO page. Given the time needed to share and unshare pages, it would probably be more efficient to copy the payload into the same page as the header. Interestingly, dom0 seems to ack all the headers first, but holds on to the payload pages for longer.
With 20 threads for just ten packets, you can imagine that the trace gets rather crowded when sending thousands!
TCP transmission
As before, the TCP picture is rather complicated:
View full screen | Download tcp.sexp
The above shows a unikernel running on my ARM Cubietruck connecting to netcat on my laptop and sending 100 TCP packets over the stream. There are three counters here:
main-to-tcp(purple) is incremented by the main thread just before sending a block of data to the TCP stream (just enough to fill one TCP segment).tcp-to-ip(red) shows when the TCP system sent a segment to the IP layer for transmission.tcp-ackd-segs(orange) shows when the TCP system got confirmation of receipt from the remote host (note: a TCP ask is not the same as a dom0 ring ack, which just says the network driver has accepted the segment for transmission).
There is clearly scope to improve the viewer here, but a few things can be seen already. The general cycle is:
- The unikernel is sleeping, waiting for TCP acks.
- The remote end acks some packets (the orange line goes up).
- The TCP layer transmits some of the buffered packets (red line goes up).
- The TCP layer allows the main code to send more data (purple line goes up).
- The transmitted pages are freed (the dense vertical green lines) once Xen acks them.
I did wonder whether we unshared the pages as soon as dom0 had read the segment, or only when the remote end sent the TCP ack.
Having the graphs overlaid on the trace lets us answer this question - you can see that when the red line goes up (segments sent to dom0), the ring.write thread that is created then ends (and the page is unshared) in response to ring.poll ack_responses, before the TCP acks arrive.
TCP starts slowly, but as the window size gets bigger and more packets are transmitted at a time, the sleeping periods get shorter and then disappear as the process becomes CPU-bound.
There's also a long garbage collection period near the end (shortly before we close the socket). This might be partly the fault of the tracing system, which currently allocates lots of small values, rather than writing to a preallocated buffer.
Disk access
For our final example, let's revisit the block device profiling from last time. Back then, making a series of read requests, each for 32 pages of data, produced this chart:
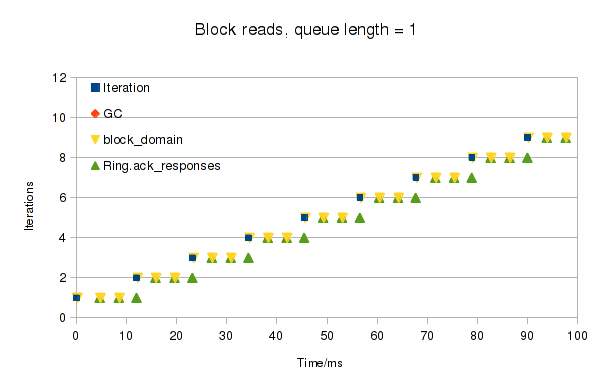
With the new tracing, we can finally see what those mysterious wake-ups in the middle are:
View full screen | Download disk-direct.sexp
Each time the main test code's read call returns, the orange trace ("read") goes up. You can see that we make three blocking calls to dom0 for each request. I added another counter for the number of active grant refs (pages shared with dom0), shown as the red line ("gntref"). You can see that for each call we share a bunch of pages, wait, and then unshare them all again.
In each group of three, we share 11 pages for the first two requests, but only 10 for the third. This makes obvious what previously required a careful reading of the block code: requests for more than 11 pages have to be split up because that's all you can fit in the request structure. Our request for 32 pages is split into requests for 11 + 11 + 10 pages, which are sent in series.
In fact, Xen also supports "indirect" requests, where the request structure references full pages of requests. I added support for this to mirage-block-xen, which improved the speed nicely. Here's a trace with indirect requests enabled:
View full screen | Download disk-indirect.sexp
If you zoom in where the red line starts to rise, you can see it has 32 steps, as we allocate all the pages in one go, followed by a final later increment for the indirect page.
Zooming out, you can see we paused for GC a little later. We got lucky here, with the GC occurring just after we sent the request and just before we started waiting for the reply, so it hardly slowed us down. If we'd been unlucky the GC might have run before we sent the request, leaving dom0 idle and wasting the time. Keeping multiple requests in flight would eliminate this risk.
Implementation notes
I originally wrote the viewer as a native GTK application in OCaml. The browser version was created by running the magical js_of_ocaml tool, which turned out to be incredibly easy. I just had to add support for the HTML canvas API alongside the code for GTK's Cairo canvas, but they're almost the same anyway. Now my embarrassing inability to learn JavaScript need not hold me back!
Finding a layout algorithm that produced sensible results was the hardest part. I'm quite pleased with the result. The basic algorithm is:
- Generate an interval tree of the thread lifetimes.
- Starting with the root thread, place each thread at the highest place on the screen where it doesn't overlap any other threads, and no higher than its parent.
- Visit the threads recursively, depth first, visiting the child threads created in reverse order.
- If one thread merges with another, allow them to overlap.
- Don't show bind-type threads as children of their actual creator, but instead delay their start time to when they get activated and make them children of the thread that activates them, unless their parent merges with them.
For the vertical layout I originally used scrolling, but it was hard to navigate.
It now transforms the vertical coordinates from the layout engine by passing them through the tanh function, allowing you to focus on a particular thread but still see all the others, just more bunched up.
The main difficulty here is focusing on one of the top or bottom threads without wasting half the display area, which complicated the code a bit.
Summary
Understanding concurrent programs can be much easier with a good visualisation. By instrumenting Lwt, it was quite easy to collect useful information about what threads were doing. Libraries that use Lwt only needed to be modified in order to label the threads.
My particular interest in making these tools is to explore the behaviour of Mirage unikernels - tiny virtual machines written in OCaml that run without the overhead of traditional operating systems.
The traces produced provide much more information than the graphs I made previously. We can see now not just when the unikernel isn't making progress, but why. We saw that the networking code spends a lot of time handling ack messages from dom0 saying that it has read the data we shared with it, and that the disk code was splitting requests into small chunks because it didn't support indirect requests.
There is plenty of scope for improvement in the tools - some things I'd like include:
- A way to group or hide threads if you want to focus on something else, as diagrams can become very cluttered with e.g. threads waiting for shared pages to be released.
- The ability to stitch together traces from multiple machines so you can e.g. follow the progress of an IP packet after it leaves the VM.
- A visual indication of when interrupts occur vs when Mirage gets around to servicing them.
- More stats collection and reporting (e.g. average response time to handle a TCP request, etc).
- A more compact log format and more efficient tracing.
But hopefully, these tools will already help people to learn more about how their unikernels behave. If you're interested in tracing or unikernels, the Mirage mailing list is a good place to discuss things.